While writing a blog piece on the Establishment, I wanted to include statistics for the number of MPs, civil servants etc. who graduated from Oxbridge, Russell Group or any university, and how the subjects they studied compared with the subjects studied by graduates throughout the population.
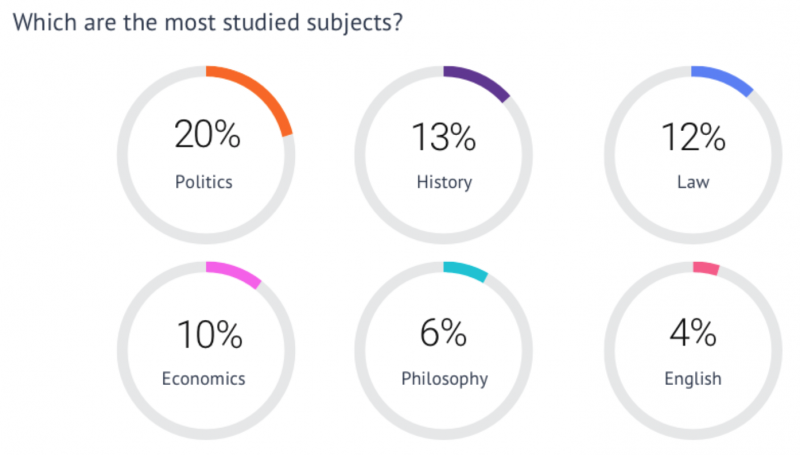
The first part was relatively easy. Studee.com had published a recent analysis of MPs' educational background. The basic figures are: 85% of MPs are graduates, 19% went to Oxbridge, and the most popular subjects were:
Meanwhile, a recent Sutton Trust report records the disproportionate representation of Oxbridge and Russell-Group graduates amongst senior figures in the civil service, law, media, politics and other centres of power (to a more disproportionate degree even than private-school education). And a former senior civil servant notes the prominence of certain Oxbridge courses (especially PPE but also Greats, History and Law, in a close parallel with the leading subjects for politicians) in the upper echelons of the civil service.
That's all very interesting, but it doesn't tell us whether these MPs and civil servants are typical or not, unless we know the distribution in the general population. So I thought I'd get the national distribution from the data published by the Office for National Statistics.
UK data from the ONS
Fat chance! As usual, the ONS makes public only the processed data contained within their published analysis. If they have made public the underlying data for members of the public to perform their own analysis, they have hidden it well. They obviously have the data, because they could not have calculated their published statistics without it. They simply choose not to share it.
Ironically, the difficulty of obtaining this data from official UK sources illustrates the paternalistic attitude of the Establishment, which I hoped the data would help to explain. The principle is clearly that the information available to the plebs should be carefully rationed lest they get ideas above their station or even (heaven forfend) use it to challenge the current dispensation.
European data from Eurostat
So I turned to Eurostat, which I have learnt from experience is more likely to make relevant data available to the public. Sure enough, they publish the proportions that have completed various levels of education in various subjects in minute detail. The cross-cutting categories include:
- Level of education, divided into:
- Upper secondary education - vocational
- Post-secondary non-tertiary education - vocational
- Tertiary education
- Short-cycle tertiary education
- Bachelor's or equivalent level
- Master's or equivalent level
- Doctoral or equivalent level
- Subject, grouped by 13 broad headings or 169 detailed categories
- Unit of measure (unfortunately only available as percent, not absolute numbers)
- Sex
- Geography
- Time (i.e. year, from 2012 upto 2017 at time of writing)
You have to dig into the supporting information to find out what this data represents. Each year appears to give the proportions of the graduates who graduated in that year, not the proportions of graduates in the total or working population in that year. That is sub-optimal, as is the relatively limited date range available, but it's a lot better than what is available from the ONS.
You can see that the variation from year to year since 2012 is not that great. The figures therefore give a reasonable indication of the distribution amongst recent graduates. Because of the massive escalation in the proportion of the population doing tertiary education, the recent proportion probably dominates the total proportion, but is probably not a good indication of the proportions amongst the population in their 40s upwards, which is perhaps more relevant to the distribution amongst MPs, given their average age.
But we can only use what we've got, and the figures are interesting from a social/cultural/economic perspective quite apart from my original interest in the education of the British Establishment. There are wide variations in the preferences for subjects in different European nations, which tell us something about what each nation values. I have charted below how our preferences compare with our European neighbours over a wide variety of subject groups or individual subject headings. But first, what does this tell us about the UK and our MPs?
Contrasting distributions: graduate MPs vs all recent graduates
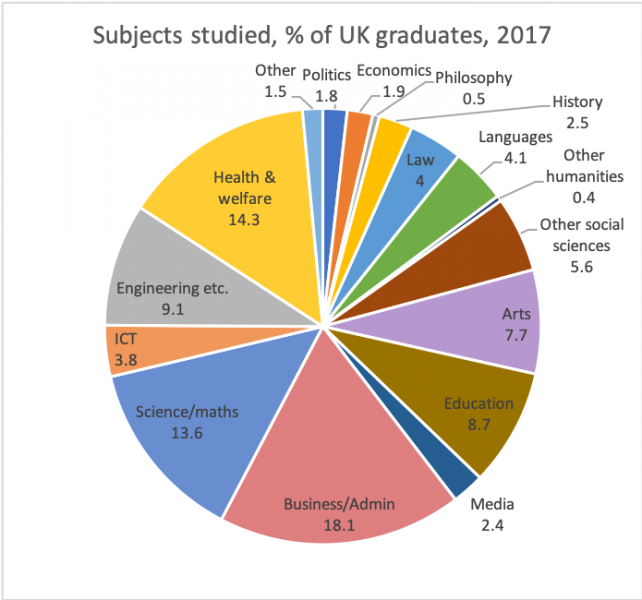
It is an imperfect comparison, for the reasons explained above, but it is nevertheless instructive to compare the distribution of subjects studied by (a) our current MPs and (b) 2017 graduates.
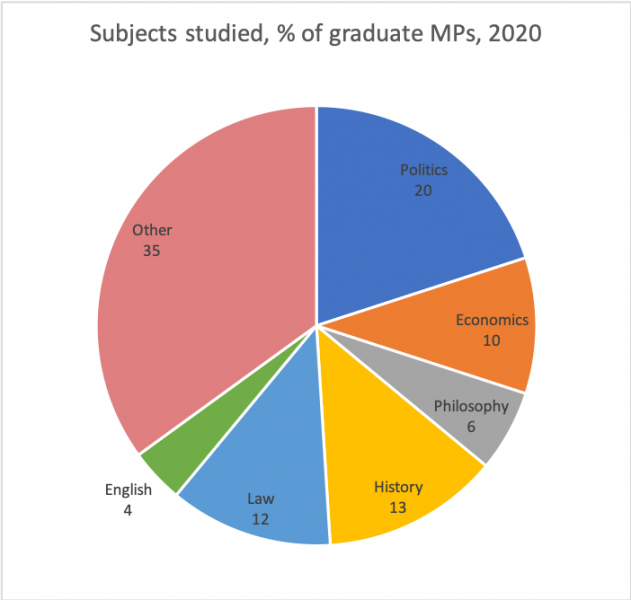
Mixed-subject degrees like Politics, Philosophy and Economics (PPE) are ubiquitous in the political class. It seems likely that the separate percentages for Politics, Economics and Philosophy do not accurately reflect the subjects studied and may over-represent Politics as the first of the PPE subjects. I am inclined to treat them jointly.
35% of graduate MPs (who are 85% of all MPs) studied one or more of the PPE subjects. 4.2% of recent graduates studied those subjects. Graduates are still well under half of the UK population, so PPE graduates represent less than 2% of the population, but around 30% of MPs.
Perhaps you think that is not unreasonable. MPs work in the field of politics. Perhaps more than 30% (not fewer) of them should be qualified in their field?
And their job is to scrutinise legislation, so perhaps we want more than 12% who studied the law as well?
I will agree to one element of that: we should not expect MPs to mirror society at large. 50% of the population have below-average intelligence. We do not want the same to be true of MPs. They should be highly unrepresentative.
But they should be diverse. We want great minds from as wide a range of backgrounds and fields as possible, not an elite whose main qualification to govern is that they have been taught to over-estimate the power of their intelligence by even-more-intelligent people with little knowledge or understanding of real life (what I call the Oxbridge Lobotomy).
Look at the subjects that didn't make MPs' Top 6:
- education,
- business and administration,
- science, mathematics and statistics,
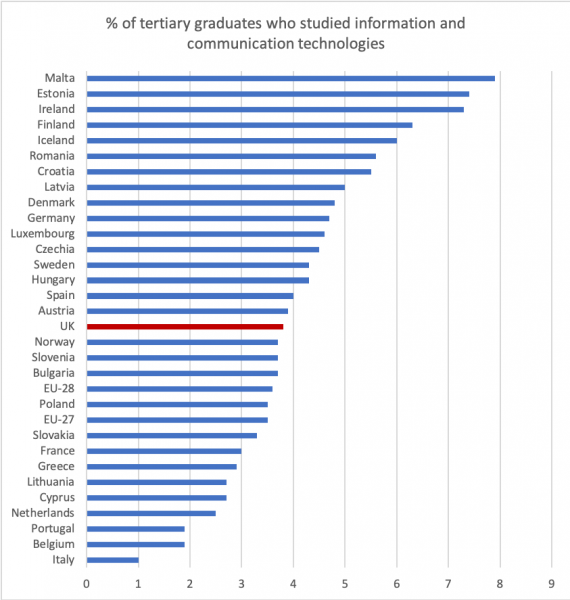
- information and communication technologies,
- engineering, manufacturing and construction,
- health and welfare,
- agriculture, forestry, fisheries and veterinary science,
- services, etc.
These subjects account for over 85% of graduates and almost all of the real economy, but barely one-third of graduate MPs. Are we really saying that knowledge of politics, philosophy and economics is massively more useful in our legislators than knowledge of these subjects?
We know minimal numbers studied these subjects, because the sixth-placed subject (English) was down at 4%. None of the subjects in the list above was studied by as much as 4% of the graduate MPs.
What national differences tell us about national strengths and priorities
See below for charts of the proportions of graduates in each field by European nation. What they tell us about the UK's priorities vs its neighbours is:
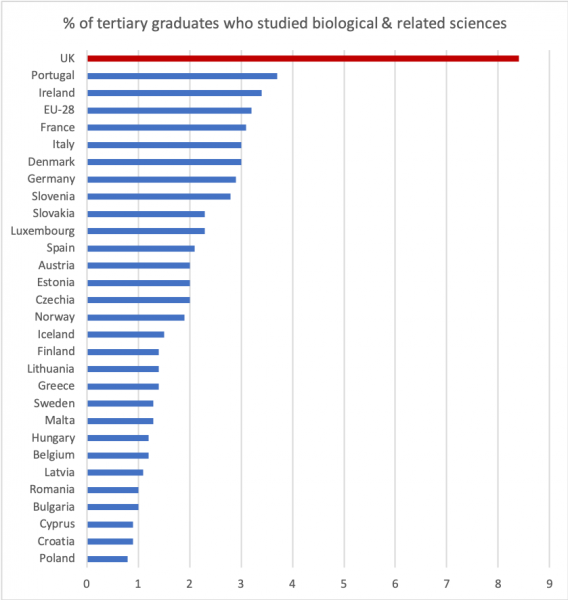
- We are very keen on science, and particularly biological science.
- 13.6% of UK graduates studied science or maths. The next highest is Greece on 9.6% and the European average outside the UK is 6.4%.
- 8.4% of UK graduates studied biological science. The next highest is Portugal on 3.7% and the EU average (including UK) is 3.2%. The UK also has a large biotechnology industrial sector. Any talk of the UK having limited capacity compared to our neighbours to address novel biological challenges (like coronavirus) is nonsense.
- We are also very keen on the arts and humanities. This is principally but not entirely because of the level of interest in the arts.
- 15.2% of UK graduates studied arts or humanities (including languages). Only Italy had a higher proportion (16.3%). The EU average is 9.9%.
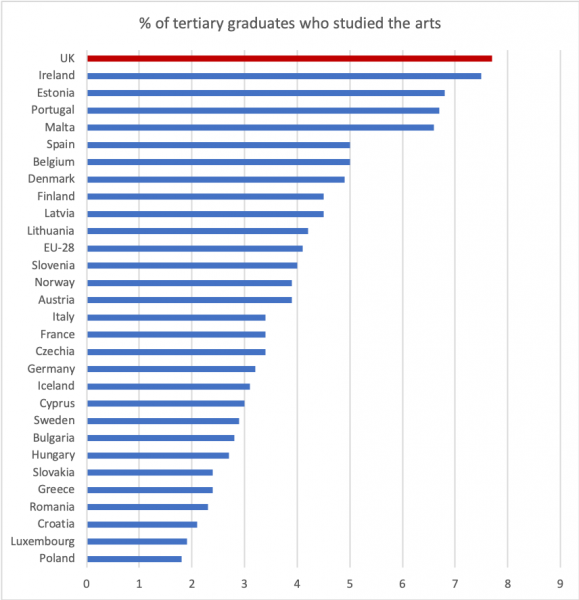
- 7.7% of UK graduates studied one of the arts. Ireland was the next highest in Europe at 7.5% and the EU average was 4.1%. This presumably reflects the strengths of the UK and Ireland in popular culture, although it is debatable whether much popular culture is a product of university education.
- 3.4% of UK graduates studied one of the humanities (exc. languages). Only Greece had a higher proportion (3.6%). The EU averge was 2.1%.
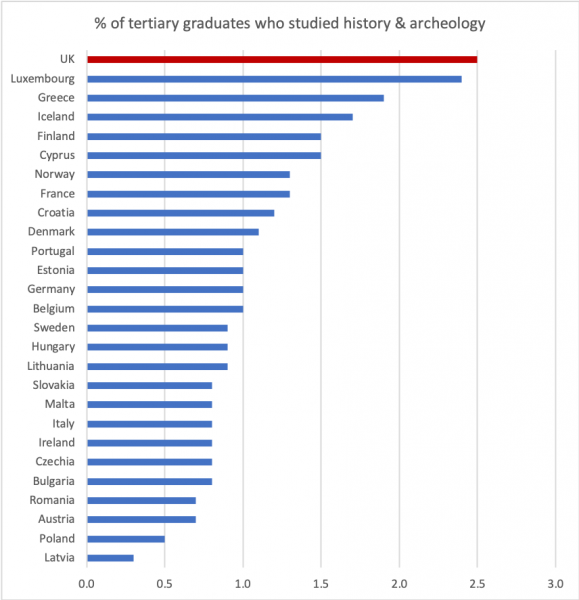
- Amongst the humanities, history is very popular in the UK. 2.5% of UK graduates studed it, compared to a European average of around 1%. Luxembourg (2.4%) and Greece (1.9%) were in 2nd and 3rd place for interest in history.
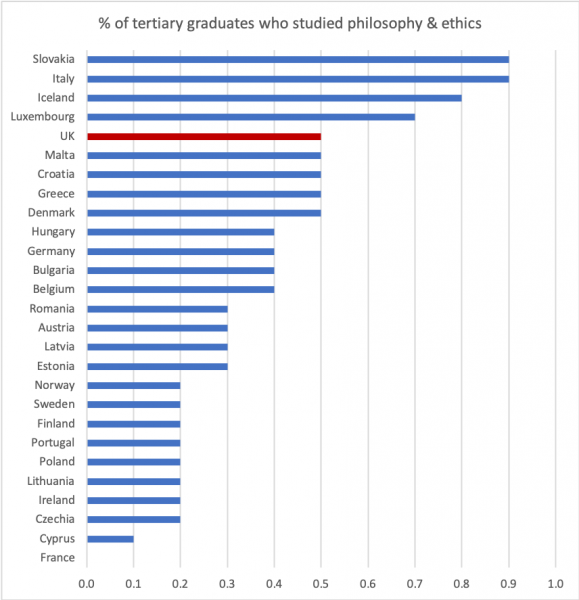
- At 0.5%, the proportion of UK graduates who studied philosophy is above the European average, but not as strongly as the previous subjects. Slovakia, Italy, Iceland and Luxembourg are more interested in philosophy than the UK.
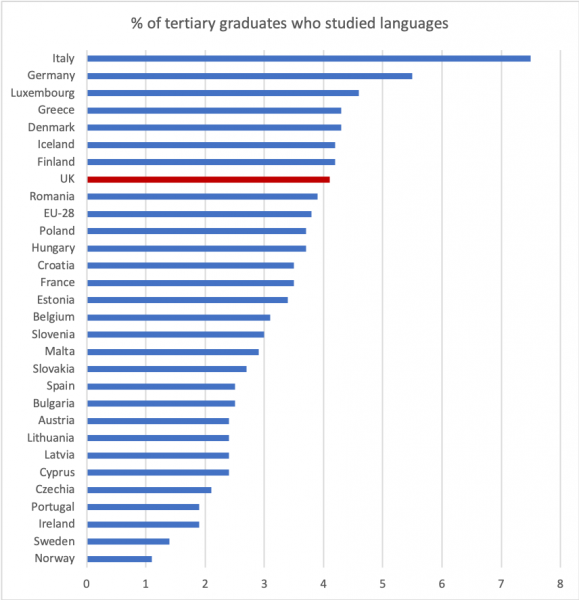
- The UK (4.1%) is just above the European average (3.8%) on language graduates. The numbers studying their native language are not given separately, so we cannot compare the appetite for foreign languages in the various European countries. One suspects that a large proportion of British language graduates studied English.
- The UK is particularly uninterested in most practical/commercial subjects:
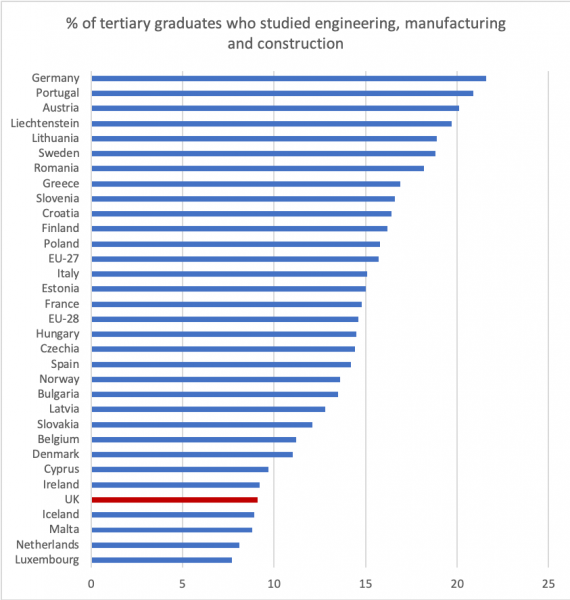
- 9.1% studied engineering, manufacturing and construction, compared to a European average (exc. Britain) of 15.7%. The only countries in which these subjects are less popular are Iceland, Malta, Netherlands and Luxembourg. At the individual subject level, the only country less interested in engineering is Luxembourg.
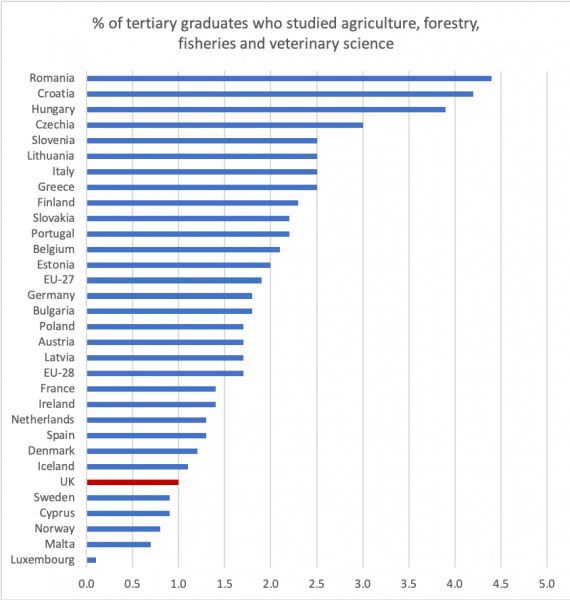
- 1% studied agriculture, forestry, fisheries and veterinary science, compared to a European average (exc. Britain) of 1.9%. Only Sweden, Cyprus, Norway, Malta and Luxembourg were less interested in these subjects.
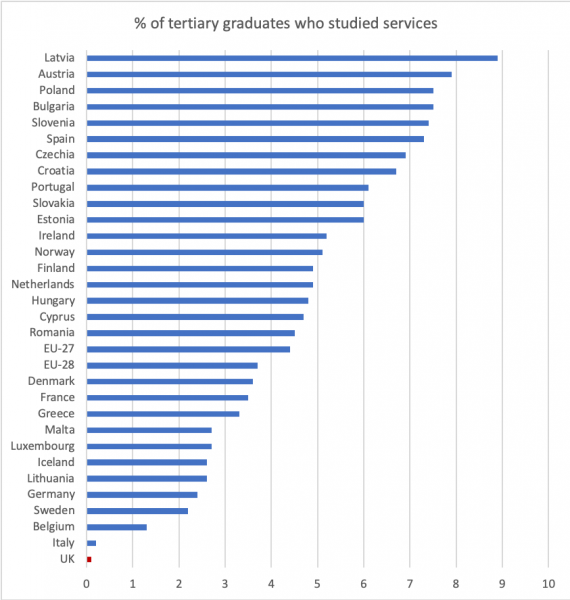
- 0.1% studied services, compared to a European average (exc. Britain) of 4.4%. For a country that switched particularly strongly from a manufacturing to a service economy, it is ironic that the UK considers services to be so unworthy of higher education that it is barely a thing. In much of the rest of Europe, it is one of the main subjects. If we included vocational non-tertiary education, it would be even more significant in those countries and still insignificant in the UK, which does not record figures for that type of education.
- In all other academic departments, the UK is roughly in the middle of the pack. See below for the individual charts.
Non-university further education
Before we look at the figures for tertiary education, one glaring illustration of the attitude of the British Establishment is the figures for post-secondary non-tertiary vocational training. The UK is so uninterested in non-university education that it simply doesn't provide Eurostat with any figures at all. It is in a minority of 6 European nations (with Croatia, Italy, Netherlands, Slovenia and Switzerland) who think universities are the be-all-and-end-all. Most European nations regard vocational, non-university education as important enough to record the figures in the same way as they record the figures for university graduates.
University education by broad subject headings
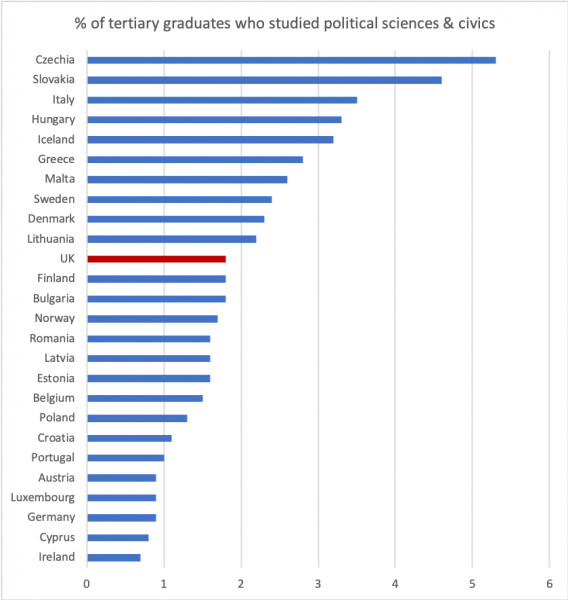
159 detailed subject categories is too many to bother listing other than where there is a specific interest. For instance, Politics falls under the "Social sciences, journalism and information" broad heading. We might take a look at the "Political sciences and civics" sub-category because it is most comparable to the most common subject studied by MPs (Politics). But there are 6 sub-categories of this major heading in total, so we will mainly look at the broad category.
In the following charts, EU-28 refers to the membership since Croatia joined and before Brexit. EU-27 excludes Britain. Liechtenstein appears sporadically because it recorded zero graduates under several broad headings. Switzerland is not included at all, as it seems not to have provided any data to Eurostat in this area. Otherwise, the list is EU + EFTA.
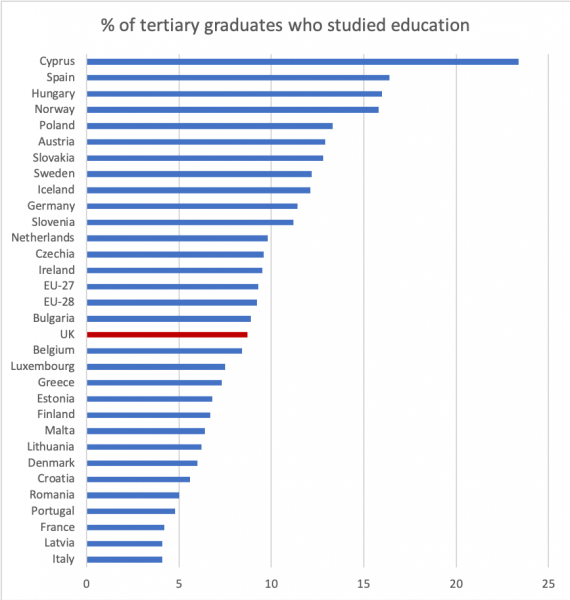
Education
The following chart illustrates the proportion of 2017 graduates who studied education. This will be repeated below for the various broad category headings without repeating this explanatory text.
Arts and humanities
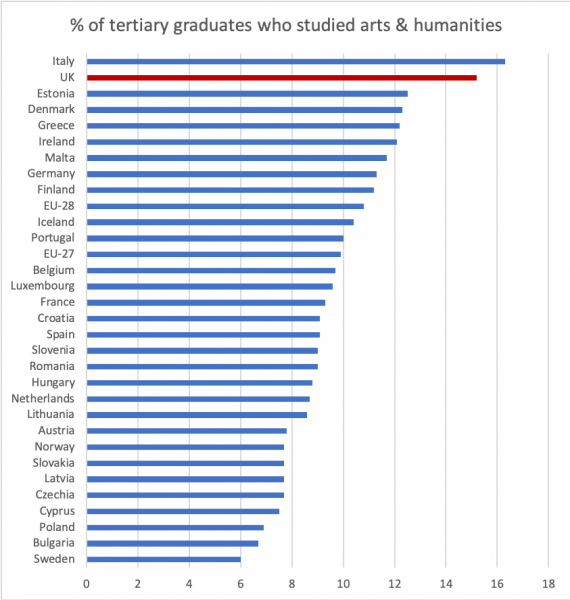
As the UK has an unusually high number of graduates in this area, and the category encompasses some of the main subjects studied by MPs, let's look at some of the subject sub-categories.
Most of the graduates in this area are studying the arts.
Arts
Languages are the next largest sub-category. This presumably includes English, probably much the largest of the languages.
Languages
The rest are mostly the humanities, including two of the MPs' favourites: history and philosophy.
History and archeology
Philosophy and ethics
Social sciences, journalism and information
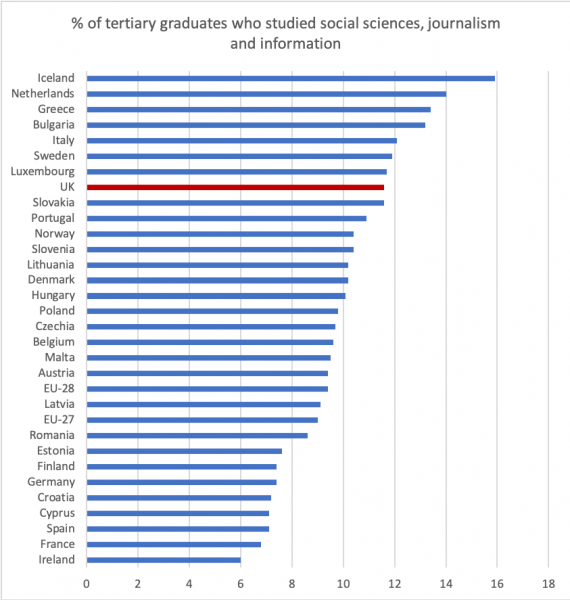
This category encompasses two of the subjects studied by many MPs: politics and economics.
Political science and civics
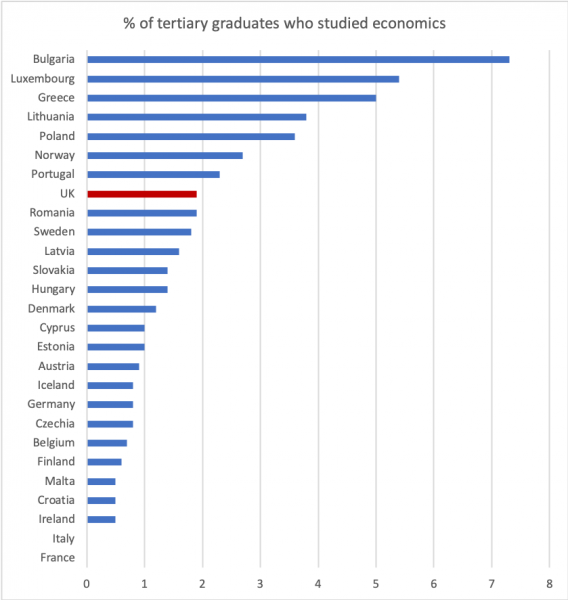
Economics
Business, administration and law
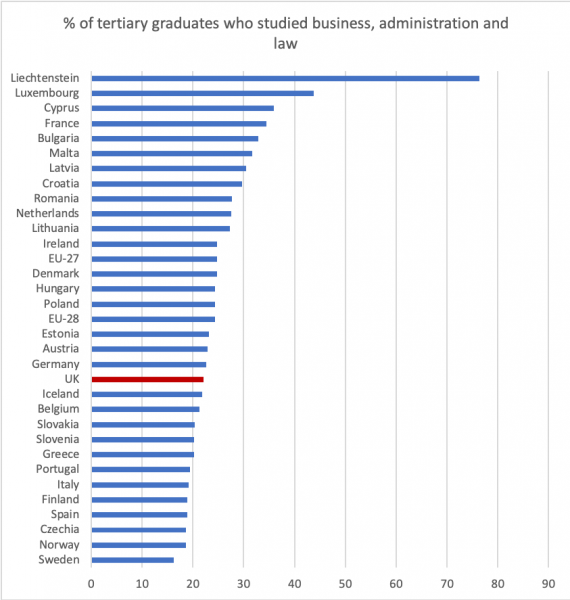
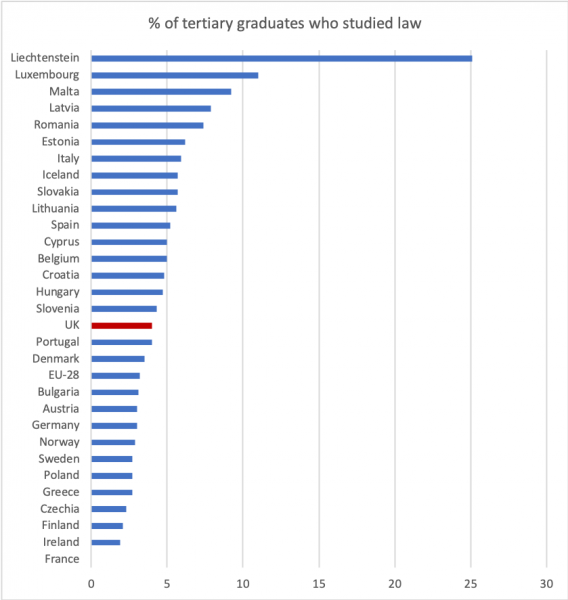
Law is another of the big subjects for MPs.
Law
Natural sciences, mathematics and statistics
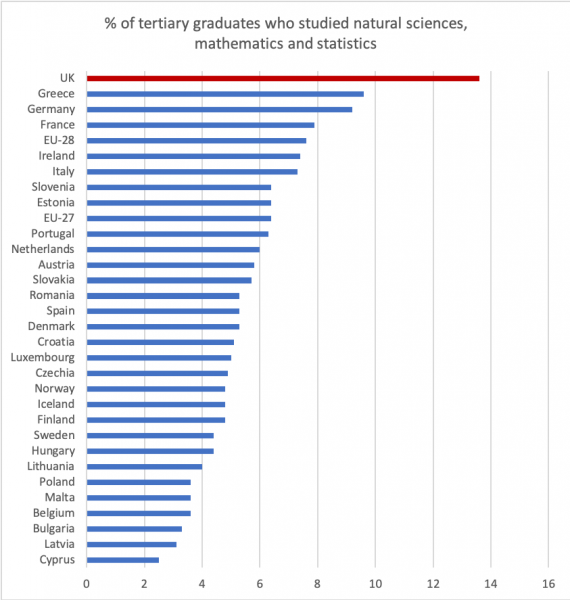
This is such a standout chart for the UK that it is worth looking at how that breaks down by subject sub-category. It turns out that this is largely the result of the numbers that study biological sciences in the UK.
Biological sciences
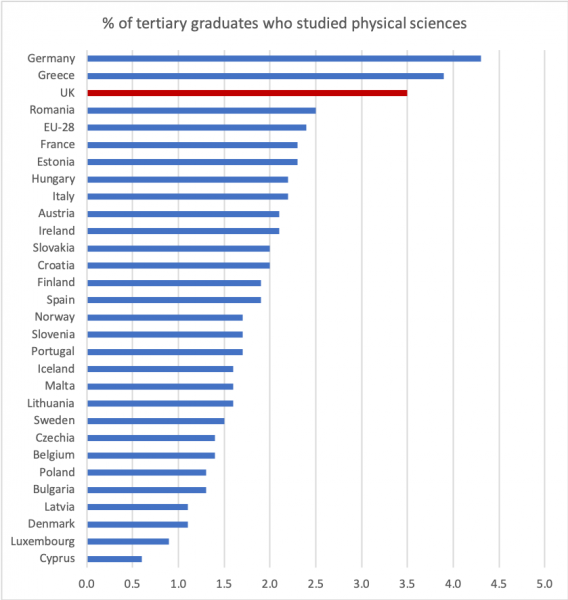
The UK was also strong in physical sciences, but not to such an anomalous extent.
Physical sciences
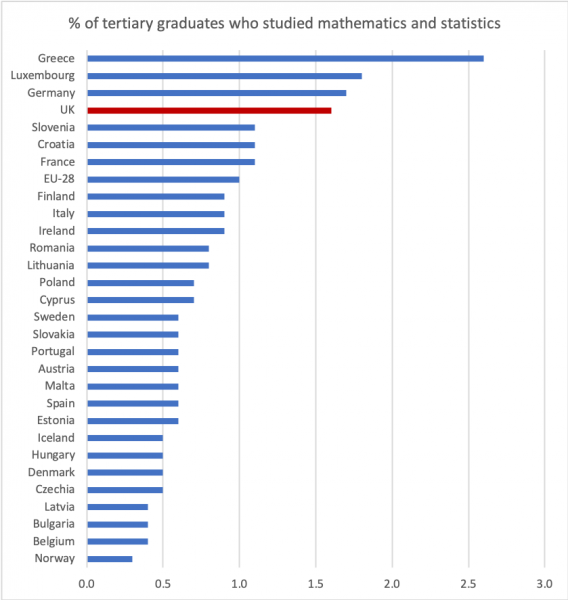
The other main subject sub-headings under this broad heading are smaller proportions and have a much smaller bearing on the UK's overall total under this heading.
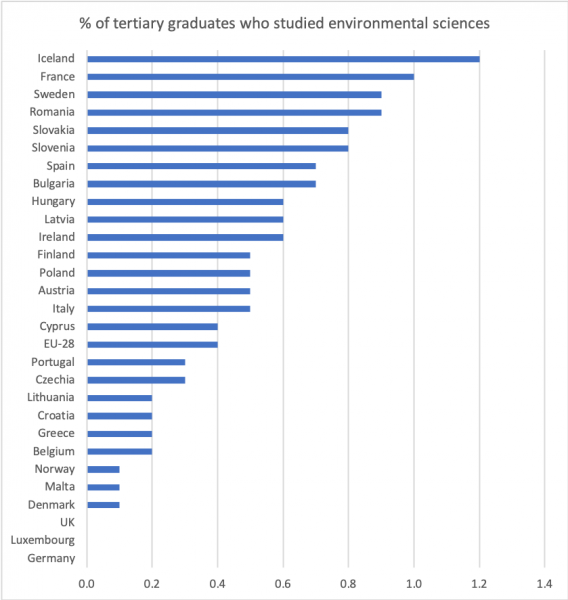
Environment
The UK lists zero percent of graduates in environmental science. That is obviously incorrect, so we must conclude that they are grouped under another heading, probably physical sciences. But the proportions for each country are so small that this will not have greatly distorted the UK's figures under whichever heading they are listed.
Mathematics and statistics
Information and Communication Technologies
Engineering, manufacturing and construction
Many of the top nations in this category also dedicate a large proportion of their vocational non-tertiary education to these subjects. The UK does not even report the proportion of people completing vocational courses in this subject.
Agriculture, forestry, fisheries and veterinary
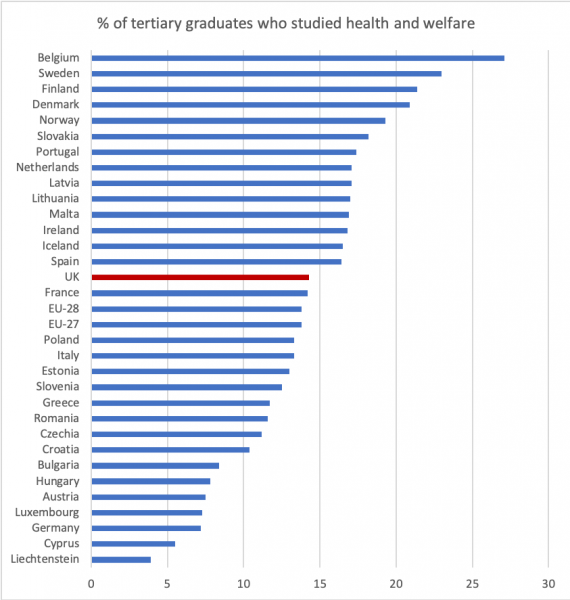
Health and welfare
This is another category that contains a large proportion of the vocational non-tertiary students in those countries that record those statistics.
Services